
A geographics information system (GIS) is a computer system for capturing, storing, checking, and displaying data related to positions on Earth’s surface. GIS can show many different kinds of data on one map. This enables people to more easily see, analyze, and understand patterns and relationships.
With GIS technology, people can compare the locations of different things in order to discover how they relate to each other. For example, using GIS, the same map could include sites that produce pollution, such as gas stations, and sites that are sensitive to pollution, such as wetlands. Such a map would help people determine which wetlands are most at risk.
Satellite Remote Sensing has been
a standard first step for the mineral and petroleum exploration industry.
Satellite imagery from satellite sensors such as GeoEye-1, WorldView-2,
QuickBird, IKONOS, ASTER and LANDSAT 7 +ETM have benefited geologists,
scientists and exploration managers in earth sciences due to the advantage of
large scale mapping and the sensors containing multiple band colors which
allows them to interpret wavelengths that cannot be seen by the human eye, such
as near infrared, short wave infrared and thermal infrared to identify the
difference in structural features of the earth’s surface.
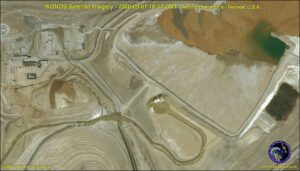
IKONOS Satellite Image of Mining
Operations in Nevada
Multispectral imaging and
thematic mapping allows researchers to collect data of reflection and
absorption properties of soils, rock, and vegetation. This data could be
utilized to interpret actual surface lithology to identify clays, oxides and
soils from satellite images.
The use of satellite imagery in
mineral exploration, generally a combination of panchromatic and multispectral
image data has been used in mineral and petroleum industries over the last
decade. With higher resolution satellite sensors increasing over the last
decade such as GeoEye-1 (0.41m) and WorldView-2 (0.46m) both providing
panchromatic and multispectral full color imagery that is used to utilize
enhanced spectral analysis for mapping, monitoring and analyzing landcover
classification and extraction of culture data, normalized difference vegetation
index (NDVI) classification and mapping, lithological classification, change
detection, environmental monitoring,
development, land-use planning, visualization and simulation
environments such as digital elevation models (DEMs) and 3d terrain modeling.
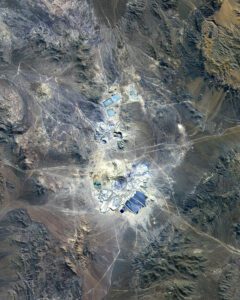
ASTER (15m) Satellite Images of
Escondida open-pit mine in Atacama Desert, Chile
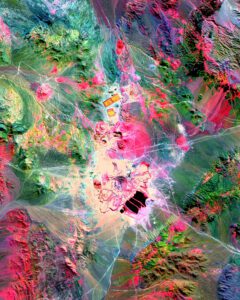
This ASTER image covers 30 by 37
km in the Atacama Desert, Chile and was acquired on April 23, 2000. The
Escondida Cu-Au-Ag open-pit mine is at an elevation of 3050 m, and came on
stream in 1990. Escondida is related geologically to three porphyry bodies
intruded along the Chilean West Fissure Fault System. A high grade supergene
cap overlies primary sulfide ore. The top image is a conventional 3-2-1 RGB
composite. The bottom image displays SWIR bands 4-6-8 in RGB, and highlights
lithologic and alteration differences of surface units. Imagery Credit:
NASA/GSFC/METI/ERSDAC/JAROS, and U.S./Japan ASTER Science Team.
Geologists and Geoscientists have
used satellite images to serve as databases from which they can do the
following:
- Pick out rock units (stratigraphy)
- Study the expression and modes of the origin of landforms (geomorphology)
- Determine the structural arrangements of disturbed strata (folds and faults)
- Evaluate dynamic changes from natural events (e.g., floods; volcanic eruptions)
- Seek surface clues (such as alteration and other signs of mineralization) to subsurface deposits of ore minerals, oil and gas, and groundwater.
- Function as a visual base on which a geologic map is drawn either directly or on a transparent overlay.
- digital elevation model argyle_view_diamond_mine_3d
ASTER Satellite Image of Argyle
Diamond Mine, Australia- DEM
A well collated and structured
data base integrated into a powerful GIS project can be used to collect and
create valuable data for the planning and exploration program for:
- The advantage of creating large scale area maps which allows them to examine in single scenes or in mosaics the geological portrayal of Earth on a regional basis.
- The ability to analyze multispectral bands quantitatively in terms of numbers permits them to apply special image processing techniques to discern and enhance certain compositional properties of Earth materials.
- The capability of merging different types of remote sensing products (e.g., reflectance images with radar or with thermal imagery) or combining these with topographic elevation data (DEMs) and with other kinds of information bases (e.g., thematic maps; geophysical measurements and chemical sampling surveys) enables views of existing or planning of proposed mines.
- Mapping subregional surface geology.
- Creating field exploration maps with detailed views of access roads.
Remote sensed data and GIS for
mineral exploration is a key to management, planning and monitoring programs
requiring on accurate information about the land cover in a region. Methods for
monitoring vegetation and land change range from intensive field sampling with
plot inventories to extensive analysis of remotely sensed data which has proven
to be more cost effective for large regions, small site assessment and
analysis.

No comments:
Post a Comment