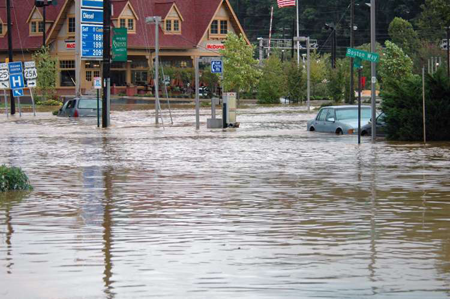
Most flood maps today are not
maps of real-life floods; they are maps of an imaginary flood used to help
communities get an idea of where especially flood prone areas probably are.
Sometimes these are called "100-year flood maps," although that
phrase is a little misleading because it is based on statistical probabilities
for some specific location, not for a region. There's a good chance that a
"100-year flood" will occur somewhere in your state every year.
Flood forecasts (like the ones
seen on TV newscasts) are made by the National Weather Service for storms days
in advance of the actual flooding. These forecasts estimate the highest level
the river will get, based mainly on how much rain is expected. Unfortunately,
the forecasts are made only for a few specific places; they don't predict flood
levels for anywhere except those specific places. So, unless you live near one
of these "forecast points," the predictions are good only as a rough measure
of how large the flood is predicted to be. They don't tell you whether your
house, or a school, or your local sewage treatment plant is in danger of being
flooded. Even if you do live near a forecast point, the forecast is still only
an elevation describing the highest expected river level. It doesn't mean a lot
to you unless you know your elevation compared to the reference elevation, or
"datum," of the forecast point. What you want if you live in a
floodplain, whether you live near a forecast point or not, is a map that shows
where flooding is expected.
When the NWS issues a forecast
flood hydrograph (plot of flow vs. time) for a particular location, the USGS
uses the hydrograph to create a flood-inundation map. The USGS has developed
methods to make maps of these forecast floods for long stretches of a river
near forecast points. These maps fill a critical information gap in flood
forecasting: information on when and where floodwater from an approaching storm
will arrive. The maps also show how deep the water is expected to be all across
the floodplain. In essence, these methods combine to make a somewhat obscure
"peak forecast elevation" into a map with flooded areas, times-of-arrival,
and flood depths.
A number of new technologies and
methods make the creation of flood forecast maps possible. First is the ability
to get very accurate elevations throughout the floodplain quickly and
affordably. This is done with "LIDAR" technology (see more below).
Second is a computer program (TRIMR2D) that can simulate flood flows all across
the floodplain and many, many miles downstream from the forecast point. Third
is spatial analysis software (GIS) that turns the model results into maps and
overlays them on other maps, like a map of a neighborhood, or even onto an
aerial photograph. Last is software (IMS) that makes the maps available on the
Internet in a flexible and user-friendly way. (You can see a demonstration of
the system on the Web at http://wa.water.usgs.gov/projects/pugethazards/urbanhaz/MappingNWS.htm.)
LIDAR-Based System Collects Data
Quickly, Accurately
Light Detection And Ranging
(LIDAR) technology collects high-accuracy elevation data (better than 1-foot
accuracy) for very large areas very quickly and at lower cost than traditional
methods. The concept is quite simple: it's essentially a laser rangefinder in
an airplane, but it's no ordinary laser rangefinder.

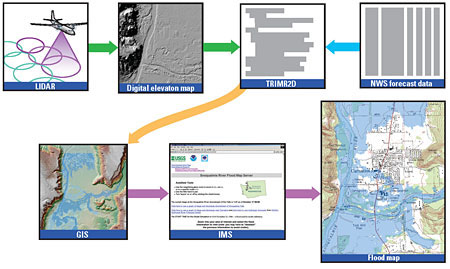
Figure 3
Figure 3. A geographic
information system (GIS) takes LIDAR elevations data and information from the
TRIMR2D model to build maps of areas that likely will be inundated, based on
the National Weather Service forecast flood.
LIDAR systems use lasers that
pulse tens of thousands of times a second. To turn a laser-determined distance
into the elevation of a point on the ground requires sophisticated hardware and
software. First, you need to know the location of the airplane to within less
than an inch at all times. This is done with a high-precision Global
Positioning System (GPS). Next, you must know the orientation of the airplane
(nose up or down, wings level or not) with similar precision. This is done with
Inertial Navigation Units (INUs) so advanced and accurate they are considered
military secrets and must be licensed by the government.

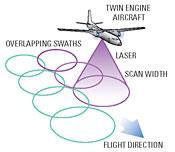
Figure 4
Figure 4. Typical Light Detection
And Ranging (LIDAR) typical system used to collect high-accuracy elevation data
needed to make flood maps.
The LIDAR system collects
billions of elevation values, but commonly most of the laser reflections are
off of tree tops, shrubs, bridge decks, vehicles, even telephone poles. Sorting
through all these points to find the ones that are really "on the
ground" requires complex and often tedious computer processing. But as
difficult as all this sounds, it's still less expensive, faster, and more
accurate than anything that was available before.
What does LIDAR mean for flood
mapping? It means that the computer programs (flow models) can simulate floods
over the entire floodplain, rather than for just a few dozen cross-sections. In
the past, elevation data was collected manually in the field, and because
that's very expensive, only cross-sections were measured. Flow models therefore
could simulate flow in one dimension through these cross-sections. With
elevation data available for the entire floodplain, flow can be simulated
everywhere. This type of simulation, two-dimensional, gives us a much more
detailed picture of where water will go during a flood.
TRIMR2D Computer Model is
Exceptionally Stable
Flow models are computer programs
that attempt to solve equations that describe the physics of fluid flow.
Because the set of equations is very large, a critical feature of all models is
the method they use to arrive at a solution. The larger the area being modeled,
the larger the set of equations, and the more difficult it is to arrive at a
solution. So the size of area that can be simulated is limited by the solution
method. Two-dimensional models, which simulate flow throughout the entire
floodplain, are much larger than one-dimensional models, so the solution method
is especially important.
The ability of a model to
successfully solve large problems is referred to as "stability." This
is because of the iterative way the model attempts to solve the problem,
closing in gradually on the solution. For very difficult problems, the model
will perpetually overshoot the answer and never reach a solution—a condition
called "numerical instability." TRIMR2D is a two-dimensional model
that uses a unique and especially stable solution method, so it can solve much
larger problems—for much larger areas—than other two-dimensional models.
Stability limits not only the size of the area that can be simulated, but also
the ability to solve flow predictions that involve very large or fast changes
in flow. TRIMR2D has demonstrated that it can solve equations not only for
large areas, but also for problems that have large and fast flow changes.
The stability of TRIMR2D is due
to a solution method that separates the more stable terms in the equations from
the less stable terms, and then solves them in a manner that minimizes the
effect of the less stable terms. In modeling terms, TRIMR2D is called a
semi-explicit, semi-lagrangian, finite-difference, two-dimensional,
depth-averaged hydraulic model.
GIS Draws the Map
A Geographic Information System,
GIS, is a state-of-the-art database that includes a location with each piece of
information. A GIS is used to manipulate, calculate, and process information
that is inherently spatial in nature—all of the data is related to some point
on the ground. Elevation data is a good example; all points on the ground have
their own value of elevation. A GIS also can make maps of these data; they are
so good at making maps that some people mistake them as merely mapping tools.
For making flood forecast maps,
the GIS uses one of several common processing methods—cell-based, or raster,
calculation. This method is well suited for processing the solution provided by
TRIMR2D, which is in a raster format (raster means all data is for locations
that are evenly spaced on the ground, like a checkerboard).
The GIS uses the model results to
make maps of the entire floodplain showing areas that are likely to be flooded
and how deep the water may get, when the floodwater will likely first arrive,
and when the flood will crest.
Internet Map Server Delivers the
Information
To deliver these information
layers in a useful manner to emergency responders and the public, an Internet
Map Server (IMS) is employed. This system allows the IMS author to make a
variety of data layers available to the end user so that they can customize the
map to their needs by selecting or turning off various information or reference
layers. The information available and the appearance of symbols are scale
dependent, allowing a great amount of flexibility to both the author and the
user.

No comments:
Post a Comment